- IDC Corporate
- Device Market Trends
- Smartphone Market Insights
- Current: Monthly Pricing Index
Monthly Mobile Phone Pricing Index
Updated: 14 June 2024
Mobile Phone Pricing Index Sees Continuous Decline in Average Advertised Pricing, According To IDC’s Mobile Phone Pricing Index
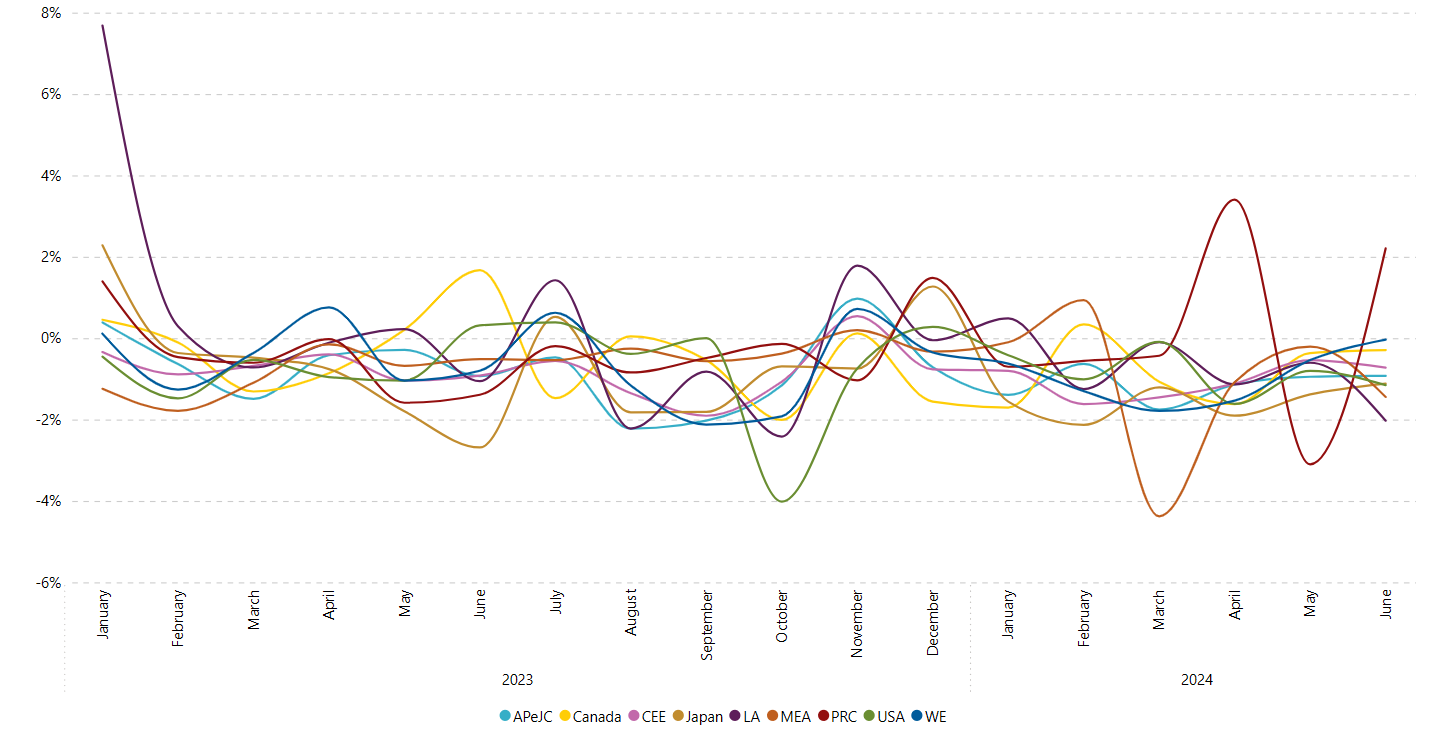
NEEDHAM, Mass., June 14, 2024 – The International Data Corporation (IDC) has released its latest findings on mobile phone pricing, indicating that the average advertised pricing continues to follow a downward trend globally. Between June 2023 and June 2024, IDC analyzed over a million advertised mobile phone prices from more than 1,100 resellers across nearly 80 countries. During the past 6 months, the pricing trend remained the negative growth trend, with decreases ranging from -0.3% to -2.0%. These figures are consistent with the observations made in the first half of 2024. The decline deepened in March 2024, reaching -2.0%, then recovered slightly to -1.2% in April and -0.6% growth in June this year.
According to regional analysis, all areas experienced a decline in average advertised pricing. PRC saw the smallest decline at 0.02%, while the Middle East and Africa (MEA) and Japan experienced minimal declines of 0.4% and 0.7% respectively. USA had the most significant decline at 3.8%, followed by Canada and Latin America, both experiencing a 2.6% decline. APeJC and Western Europe saw declines of 1.3% and 2.0% respectively. Overall, the average advertised pricing decreased by 0.6% this month.
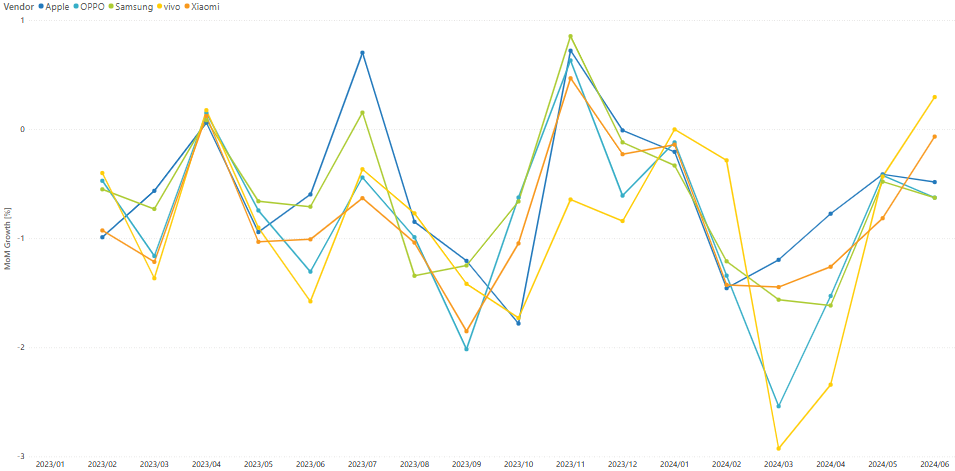
Among the top five vendors, namely Apple, Samsung, OPPO, vivo, and Xiaomi, all experienced a negative growth in their average advertised pricing compared to the previous month except vivo. Apple, OPPO and Samsung maintained the downward trend with their negative growth ranging from -0.5% to -0.6% in June. Vivo and Xiaomi experienced a slight upward trend, but the shift was relatively mild.
IDC PWI Growth vs Baseline - by Region
| Date | APeJC | Canada | CEE | Japan | LA | MEA | PRC | USA | WE |
|---|---|---|---|---|---|---|---|---|---|
| 2023/01 | 0.4% | 0.5% | -0.3% | 2.3% | 7.7% | -1.2% | 1.4% | -0.5% | 0.1% |
| 2023/02 | -0.6% | -0.1% | -0.9% | -0.4% | 0.3% | -1.8% | -0.5% | -1.5% | -1.3% |
| 2023/03 | -1.5% | -1.3% | -0.7% | -0.5% | -0.7% | -1.1% | -0.6% | -0.5% | -0.4% |
| 2023/04 | -0.4% | -0.9% | -0.4% | -0.8% | -0.1% | -0.1% | 0.0% | -1.0% | 0.8% |
| 2023/05 | -0.3% | 0.2% | -1.0% | -1.8% | 0.2% | -0.7% | -1.6% | -1.0% | -1.0% |
| 2023/06 | -0.9% | 1.7% | -0.9% | -2.7% | -1.1% | -0.5% | -1.4% | 0.3% | -0.8% |
| 2023/07 | -0.5% | -1.5% | -0.6% | 0.5% | 1.4% | -0.5% | -0.2% | 0.4% | 0.6% |
| 2023/08 | -2.2% | 0.0% | -1.4% | -1.8% | -2.2% | -0.3% | -0.8% | -0.4% | -1.2% |
| 2023/09 | -2.0% | -0.5% | -1.9% | -1.8% | -0.8% | -0.6% | -0.5% | 0.0% | -2.1% |
| 2023/10 | -1.2% | -2.0% | -1.1% | -0.7% | -2.4% | -0.4% | -0.1% | -4.0% | -1.9% |
| 2023/11 | 1.0% | 0.1% | 0.5% | -0.7% | 1.8% | 0.2% | -1.0% | -0.7% | 0.7% |
| 2023/12 | -0.7% | -1.6% | -0.8% | 1.3% | -0.1% | -0.3% | 1.5% | 0.3% | -0.4% |
| 2024/01 | -1.4% | -1.7% | -0.8% | -1.6% | 0.5% | -0.1% | -0.7% | -0.4% | -0.6% |
| 2024/02 | -0.6% | 0.3% | -1.6% | -2.1% | -1.2% | 0.9% | -0.6% | -1.0% | -1.3% |
| 2024/03 | -1.8% | -1.1% | -1.5% | -1.2% | -0.1% | -4.4% | -0.4% | -0.1% | -1.8% |
| 2024/04 | -1.1% | -1.6% | -1.1% | -1.9% | -1.1% | -1.1% | 3.4% | -1.6% | -1.5% |
| 2024/05 | -0.9% | -0.4% | -0.5% | -1.4% | -0.6% | -0.2% | -3.1% | -0.8% | -0.5% |
| 2024/06 | -0.9% | -0.3% | -0.7% | -1.1% | -2.0% | -1.4% | 2.2% | -1.2% | 0.0% |
IDC PWI Growth from Base - By Top Brands
| Brand | 2023/02 | 2023/03 | 2023/04 | 2023/05 | 2023/06 | 2023/07 | 2023/08 | 2023/09 | 2023/10 | 2023/11 | 2023/12 | 2024/01 | 2024/02 | 2024/03 | 2024/04 | 2024/05 | 2024/06 |
|---|---|---|---|---|---|---|---|---|---|---|---|---|---|---|---|---|---|
| Apple | -99% | -56% | 6% | -94% | -60% | 70% | -85% | -120% | -178% | 72% | -1% | -20% | -145% | -119% | -77% | -41% | -48% |
| OPPO | -47% | -116% | 15% | -74% | -130% | -44% | -99% | -201% | -62% | 63% | -61% | -12% | -134% | -254% | -153% | -42% | -62% |
| Samsung | -55% | -73% | 9% | -66% | -71% | 16% | -134% | -125% | -66% | 86% | -12% | -33% | -121% | -156% | -161% | -48% | -63% |
| vivo | -40% | -136% | 18% | -90% | -158% | -36% | -77% | -142% | -173% | -64% | -84% | 0% | -28% | -293% | -234% | -43% | 30% |
| Xiaomi | -93% | -121% | 12% | -103% | -101% | -63% | -104% | -185% | -104% | 47% | -23% | -14% | -142% | -144% | -126% | -81% | -6% |
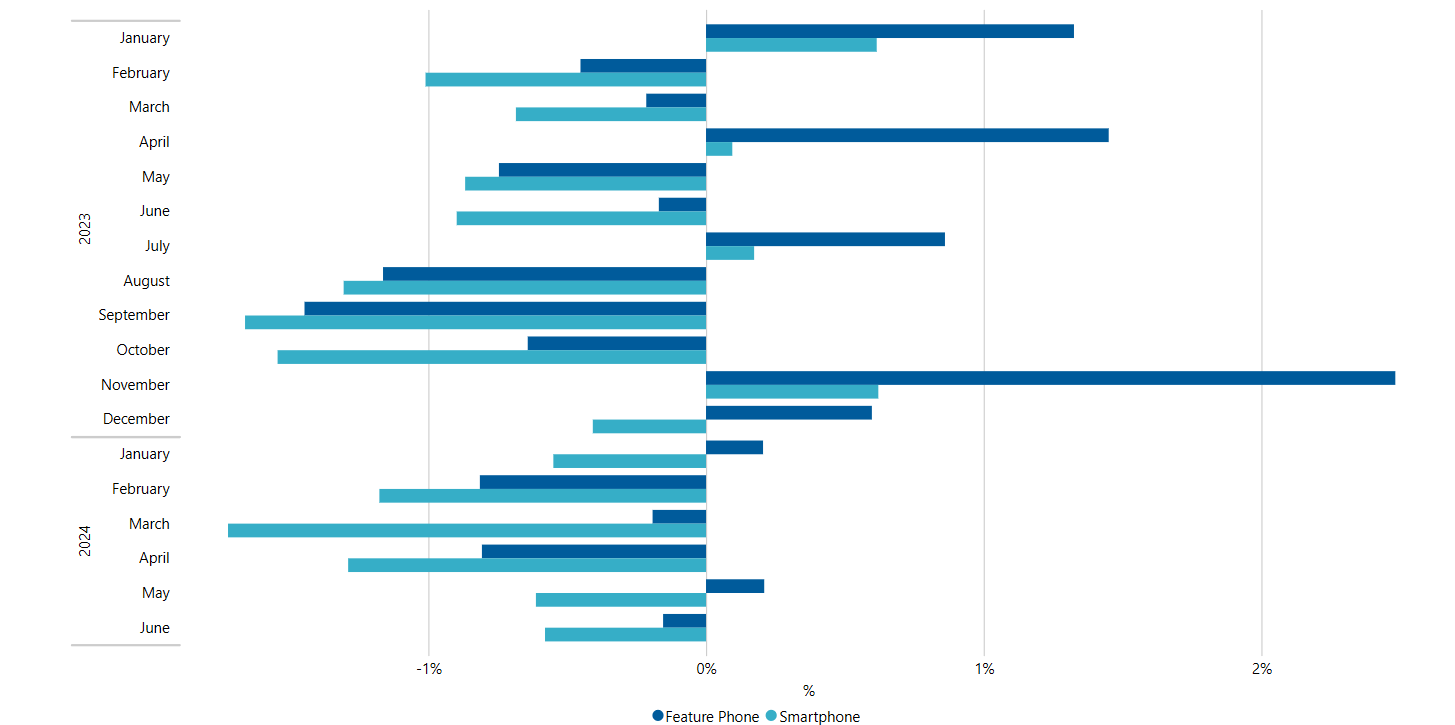
IDC PWI Growth from Base - By Product Category
| Date | Feature Phone | Smartphone |
|---|---|---|
| 2023/01 | 1.3% | 0.6% |
| 2023/02 | -0.5% | -1.0% |
| 2023/03 | -0.2% | -0.7% |
| 2023/04 | 1.5% | 0.1% |
| 2023/05 | -0.7% | -0.9% |
| 2023/06 | -0.2% | -0.9% |
| 2023/07 | 0.9% | 0.2% |
| 2023/08 | -1.2% | -1.3% |
| 2023/09 | -1.4% | -1.7% |
| 2023/10 | -0.6% | -1.5% |
| 2023/11 | 2.5% | 0.6% |
| 2023/12 | 0.6% | -0.4% |
| 2024/01 | 0.2% | -0.5% |
| 2024/02 | -0.8% | -1.2% |
| 2024/03 | -0.2% | -1.7% |
| 2024/04 | -0.8% | -1.3% |
| 2024/05 | 0.2% | -0.6% |
| 2024/06 | -0.2% | -0.6% |
IDC Pricing Watch products provide detailed monthly updates on advertised pricing that support product, channel, and go-to-market management.
IDC’s Mobile Phone Pricing Watch gathers data in nearly 80 countries and provides detailed, timely, and accurate information on Mobile Phone device pricing using a Pricing Index among other analysis. The Pricing Watch covers the core technology dimensions in IDC’s market leading Quarterly Mobile Phone Tracker – plus additional details on channels and other dimensions in monthly updates. The Pricing Watch is a valuable resource for strategic pricing and operations in the Mobile Phone market globally. For more information, or to subscribe to the research, please contact Kathy Nagamine at 650-350-6423 or knagamine@idc.com.
Interested in Other Devices?
Related News
-
May-24
-
Apr-24
-
Feb-24
Mobile Phone
Analysts
-
Popal, Nabila
Research Director, Worldwide Tracker Team
-
Reith, Ryan
Program Vice President, Worldwide Mobile Device Trackers